Simulating a Drone’s Self Localization with A Particle Filter
A Particle filter is a localization algorithm based on sampling random points and calculating the probability that your points represent the true location of the object being tracked. In this implementation, I created a simulation environment using python which contains the following functionality:
- Read and Draw an image from a file
- Calculate a Grid based on the image
- Pick a random location to simulate a drone flying over the image
- Pick N more random locations for particles
- Take photos of the ground below using a square aperture of size N from the location of the drone and all the particles
- Compare the photos using an RGB histogram intersection
- Normalize the intersection values so they Sum up to 1
- Display the map with particles sized by weight
- Regenerate the particles using a Low Variance Re-sampler
- Move the drone by a random vector with magnitude 1
- Add noise to drone movement to simulate wind
- Move the particles with the drone’s velocity vector
- Repeat from step 5 indefinitely
This article is more about my optimization than an intro to a particle filter. While I will give a brief overview of how the system works, for a more comprehensive overview, I would read other resources.
Particle Filter
A particle filter is an algorithm used in various fields of computing, such as cognitive computing and signal processing. It was originally developed in 1996 by Del Moral [1], and the name is a reference to probability equations which have been used in fluid mechanics since the 1960’s. It was also further categorized as a Sequential Monte Carlo method in 1998 by Liu and Chen [2].
This specific application and example represent a common way particle filters can be used in computer vision applications. In it’s simplest form, a particle filter involves randomly sampling a possible set of solutions, calculating the probability that each one is correct based on some form of observation, and then resampling a new set based on the old set, and then repeating to develop a more accurate estimation.
if you prefer a quick visual explanation, here are a few frames of my algorithm in action.

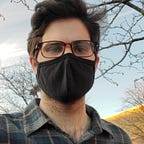
In the initial state, we generate a random location on the map. The location is marked by a dark blue circle with a white outline. In the first step, we generate N random evenly-distributed points on the map as an estimate of where we believe the drone to be.

The particles are marked by light blue circles. In my application, the radius of the circle represents the probability that a random selected point is the location of the drone. So here we can see that there are a few locations where the drone might be. One timestep is definitely not enough to locate the drone.
Now, every timestep from here, we resample the particles. The particles with a higher distribution are more likely to be selected. Then we recalculate the probability of each resampled point. We also add a bit of noise to the resampling, in terms of x,y offset from the original samples point.

From here, we can see that the second timestep greatly improves our estimation of the location. We have a few particles resampled around each of the circles from the first step that were considered highly probable. We also know the speed of the drone so after resampling, we can move all of the particles with the same speed as the drone. After that, we recalculate the probability given the new locations of the particles, we can see the algorithm was able to narrow it down even further.
How we calculate the probabilities and how to improve the basic functionality will be covered later in the article.
How to Run the Script
Download the repository from my repository, navigate to the directory called “SimulationEnvironment”, and run python3 SimulationEngine.py on the command line (You must have python 3 installed already). To run this locally, you will need a number of libraries. I did not collect all the libraries necessary, but the most important ones are numpy and opencv. There are many guides online to install these, but I used “pip install” commands for both of them.
Implementation
Drone Movement
Drone Movement is based on a randomly generated vector, with calculations to limit it from pushing the drone off of the map grid.
First I calculate the limits of the movement based on the grid, current position and velocity magnitude as [Xmin, Xmax], [Ymin, Ymax]. Then I run the following calculations:

A new velocity is generated every second and determines the movement for the drones and the particles. However, the drone also has a noise calculation. This is implemented with a random value selected from normal distribution for each x and y positions. Similar to the velocity vector, before applying noise, we check the movement boundaries and only generate noise that won’t put us over the edge of the map. For most tests, I used a variance squared of 0.2 position units. I did this because I found that a lower variance helps me to localize faster, and 0.2 seemed to be a realistic value of noise from motors and moderate wind.
Location Generation
The initial drone location generation uses the same code as the particle location generation. It is very basic and just consists of grabbing a value from a uniform distribution, somewhere within the map’s boundaries.
Particle Weight Calculation and Movement
The most complicated part of my specific filter is the weight calculation for the particles. Since there is a lot going on here, I will walk through the weight calculation step-by-step.
- On all iterations except the first one, the first thing we do is move the particles according to the drone movement. This is as simple as adding the calculated
XvelandYvelscalars to theXandYlocation of the particles. Line Here - Then rescan the area around the particle using the same aperture size as the drone. This is done by taking a subset of the total image based on the particles location and aperture size. Line here
- Next, we call the function DetermineWeights inside of the ParticleFilter.py class. The first thing that happens here is we cycle through all of the particles and get a weight for each one. As we cycle we track the max, min, and sum of all the weights. Loop here
- Determining the weights happens via an RGB histogram correlation function. We convert both the drone’s scan and the particles scan to RGB, group the histogram values into a parameterized number of bins, then run a correlation function according to OpenCv’s library. Documentation on that can be found here: OpenCV: Histogram Comparison. My implementation is here
- Since this function returns values between -1 and 1, the first thing I do with this value is set all negative results to 0. In my original implementation, I scaled the results from 0 to 1, but I actually found the filter to be better optimized by just dropping all the negative weights to 0. Line here
- After this I square the weights, I do this to give a bigger contrast between the low and high weight. This is the first step which exploits the functionality of the resample algorithm. As we are now artificially more likely to choose the higher weights during resampling, causing localization to happen quicker.
- Once I’ve done this for all the particles, I Normalize the weights for the first time. Three things happen here: I scale all the weights back (by dividing the individual weights by the total weight sum) so they sum to 1, but they keep their same relative values. Function here
- Here you can see I also calculate an alternate weight, which I have labelled as
visualWeight. The original purpose of this weight was to make the rendered map more interesting, however I found this value to be very valuable in calculations as well. The VisualWeight is simply all the weights (after scaling) distributed from 0 to 1, and it indicates the percentile of each individual particles weight within the range of weight values. I do this because I use this value to scale the particles by multiplying the visual weight by 15. - I also implemented a low-weight cutoff, where I automatically scale back all particles with a visual weight less than a certain amount to 0. This again helps narrow down bad predictions quickly, as I dump all of the particles with weights in the bottom N% of the range. I optimized this value to be 60%, through testing. Line here
- Now that we’ve dropped some weights, I need to rescale the particles again. I do this by running the same function as before, but skipping the cutoff step.
Particle Location Regeneration
After we calculate the particle locations, we can resample the particles to narrow down which particles most likely represent our location. In my system, particle regeneration happens after the image gets displayed, so it is the first thing to happen in every loop of the main function. In this project, I use the low variance sampler algorithm taken Thrun, Burgard, and Fox’s textbook [3].
I exploit some of the functionalities of the resampler when I calculate weights, but the only thing additional that isn’t described in the textbook is my resample noise generation. When I regenerate the noise particles, I add a bit of variance to the regeneration, to account for errors in the velocity of the drone, as well as increase the area for initial calculation of the drone’s location.
The noise is generated in the form of a velocity vector where both the x and y velocity and selected from a normal distribution with a variance that is inverse to the particles weight in the previous step. I also have a scaling parameter to affect noise regeneration for all particles. The equation looks somewhat like this:
Xvel = N(0, ((1 - ωadj) * F) 2)
Yvel = N(0, ((1 - ωadj) * F) 2)The purpose of using the inverse of the weight is so that particles with higher probabilities 𝑃(𝑧𝑡|𝑥𝑡) will have less variance when regenerating. If a particle has a weight near 1, the noise will be negligible. It’s worth noting that I don’t use the regular weight, but instead I use ω𝑎𝑑𝑗, my custom, adjusted weight, known as visualWeight. F is a parameterized scaling factor. My most optimized version uses a scaling factor of 0.8. Ideally, a lower factor means the end result will be more accurate, however it also reduces our chances of localizing to the particle in the first few steps, and it makes the filter vulnerable to losing the particle’s location if the RNG gives the particle a high velocity noise for any given step.
Observation
Measurement
So how do we measure how accurate our particle is, mathematically? I chose to follow two routes, the absolute average deviation, which I refer to mostly as bias, and the Variance. In the real world, without the actual location, the absolute average deviation would be impossible to measure, and the variance would be a better option, but we can use it, since it’s a simulation. The deviation formula I am using is:

In this equation, xp is the particle position, and xis the actual drone location.
For the variance, I use numpy’s built in variance function. I take the variance of both the location and the weights. For weight, I take the variance of an array filled with the weight values; for location, I take the variance of an array filled with X values, and one filled with Y values, then I perform Pythagorean theorem on those variances to get the total location variance.
Initial Test
I wanted to test my initial filter, then iterate on it, to try to reduce the variance and bias. I started with 500 particles, 50 pixels aperture, movement magnitude of 1, and using histogram intersection as my comparison function
This test was very indicative of how the filter went in initial tests:

The first state shows the fault of this setup already. There are not many particles over the whole image. While we got lucky and a particle was generated right on top of the drone, but there are many areas where the drone could exist where there are no particles nearby. After 5 steps the particles get moved to these locations:

So far, the drone has flown only over land, and it shows in the map that we have removed almost all of the particles over water. However, we haven’t quite localized the particle. It is flying over the forest and the building area near the south, I don’t imagine it will localize enough to be usable. After running for 10 more steps I can see that it was a fairly accurate assumption.

Here we can see that many particles have clumped around the drone, however there are still many other clumps in the main town on the Eastern side of the harbor, and there are still some particles in the forest to the southwest. Really the particle hasn’t been localized at all, and the system would be fairly useless in this iteration, even after 15 units of time have passed. Below I plot the variance and deviation of the particles at each step:

While the bias and variance may still decrease, I am not completely happy with the rate at which they have gone down. I want a bias of less than 1 by the 5th step.
Optimization
The first idea for improvement is the easiest, increasing the particle count. First, I would like to try doubling the particle count to 1000. Let’s see how this runs.
Doubling the Particle Count

So the result here speaks for itself. We have decreased both variance and bias. But we still haven’t localized the particle. We are somewhat certain that the particle is in the eastern town section, but we don’t know where in this town it is. We have basically localized it to the entire town. I think we need to increase the filter’s image recognition algorithm. I have two ideas to implement for this.
First, I want to use Correlation, instead of intersection. It produces a greater variance for half matches than full matches, and I will increase the amount of histogram bins to give us more data for each math. In theory this should increase the accuracy of all predictions.
RGB Histogram Correlation and Increase in Histogram Bins

After using Correlation and more bins per color channel (16 instead of 8), the image recognition becomes more strict. The Variance has decreased slightly and the bias has decreased quite a bit, but not as much as I would hope. We have localized even further to the town, but the bias is still too large for us to be certain where the drone is. Here I want to try to square the weights, which will increase the contrast, and therefore the variance between the weights, but should make the particle regeneration more strict. I estimate that this will remove the low weight particles that are outside of the town.
Squared Weights

This had a much bigger effect than I expected. But it is very telling about how increasing the variance in the particles to influence the resampling functionality can make a huge difference in the overall bias. You can see how the variance and bias increases at first, but once a good selection is made, the Bias and Variance shoots down, quickly eliminating low ranking weights. I am very happy with this progress, but I had a few more ideas to see if I can increase the rate at which the bias decreases. I still want to beat a bias of 1 by step 5.
I am going to see if I can get rid of some of the noise by manually removing particles. Actually removing the particles will create a possibility where we end up with 0 particles. Instead, once we normalize particles, I will set the lowest 25% of the particles to a weight of 0, so they get removed automatically by the re-sampling algorithm.
Minimum Particle Weight Cutoff

This was the final key in quick localization. It quickly gets rid of the low weighted particles and the bias drops to nearly 0 in 4 steps. The center of the mass of particles is very near the drone. The variance is also lower than any other method, in fact, I don’t think the variance can get any lower due to the resampling noise, which has a variance itself of 1.0. So of course, the next thing I thought to do was limit the resampling noise.
Lower Re-sampling Noise

This is the first time where I think the adjustments had an adverse effect. Our bias is much higher than the previous instance, but more importantly, I had to triple the amount of particles, which was detrimental to the performance of the filter, and could possibly keep it from operating in real time. I had to do this because the variance of the resampling was so small, that we would only “find” the drone’s location if it started with a particle right below it, and it was possible to lose the drone, since the drones velocity noise could be the same magnitude as the resampling noise. In a real world solution, I could relocate the drone by regenerating samples over the center of particles with a variance related to the weight variance, which acts as a gauge of uncertainty, though I did not implement that functionality for this project.
Another problem is these solutions only work well over the town. If I try to do the same thing over the ocean or the forest in the northwest, the results are very different. We never localize using these methods. I will reset the parameters changed in this iteration and show what happens when we start over the ocean.
Results Over Ocean

We never quite locate the exact spot of the drone. We do find the general area in the ocean where it’s located, but I think a slight improvement can be made. It’s notable that the weight variance only drops below 10 once. While we do a decent job of locating the particle. We will actually have to make the image identification more sensitive to distinguish the similar hues of blues.
Further Tuning Values

In this final Iteration. I tuned some of the parameters I introduced in the earlier iterations to make the identification work very well on water. The final parameters are as follows:
- Number of particles: 1000
- Aperture Size: 75
- Resample noise = η(0, (0. 8) * (1 − ω%)), where ω% is the percentage of the particle’s weight, in the range of all the particle weights
- Particle cutoff: ω% < 60%
- Drone Movement Noise variance = η(0, (0. 2))
- Drone Velocity Magnitude = 1.0
- Bins per color channel: 64
Thank you for reading this article. I encourage you to use these strategies to optimize your own particle filters.
Also check out my code here: Wilhite-r/ParticleFilterSimulation at 9f476e963bae73e4431ae43b323fad7464fe2720 (github.com)
All of this code is original so if you use any of it, please send me a private message. and credit me. Thank you!
Bibliography
[1] Del Moral, Pierre (1996). “Non Linear Filtering: Interacting Particle Solution” (PDF). Markov Processes and Related Fields. 2 (4): 555–580.
[2] Liu, Jun S.; Chen, Rong (1998–09–01). “Sequential Monte Carlo Methods for Dynamic Systems”. Journal of the American Statistical Association. 93 (443): 1032–1044. doi:10.1080/01621459.1998.10473765. ISSN 0162–1459.
[3] Josh Bongard; Probabilistic Robotics. Sebastian Thrun, Wolfram Burgard, and Dieter Fox. (2005, MIT Press.) 647 pages. Artif Life 2008; 14 (2): 227–229. doi: https://doi.org/10.1162/artl.2008.14.2.227